Data visualization and reporting

Business Intelligence for Industry

We offer a wide range of solutions to help you grasp all the data and information you need from across your organization.

Industrial Intelligence

Using our suite of solutions, we aggregate the data from across your organization and provide it to you in a concise and easy-to-understand manner.

This way you can have an up-to-date understanding of your business’ performance at all times.

Increase productivity with Data visualization and reporting

See what matters, not what doesn't

Data visualization and reporting solution filter out the irrelevant information in your raw data and present to you the most important and relevant metrics, so you can always focus on what really matters.

  • Translate raw data into understandable and actionable form
    The power of TT PSC Data visualization and reporting solution lies in its ability to translate raw data into clear, understandable and actionable formats. This helps manufacturing plants identify key issues, solve problems faster, and increase operational efficiency.
  • Focus on most relevant and useful data
    Don’t waste time with irrelevant reports — TT PSC solution focuses on the most important data, providing only the necessary information that can help your business stay ahead of the curve.
  • Easily create new reports
    Need a new report? No problem! With our intuitive interface you can create one in minutes – without any programming or IT skills.

What if you could?
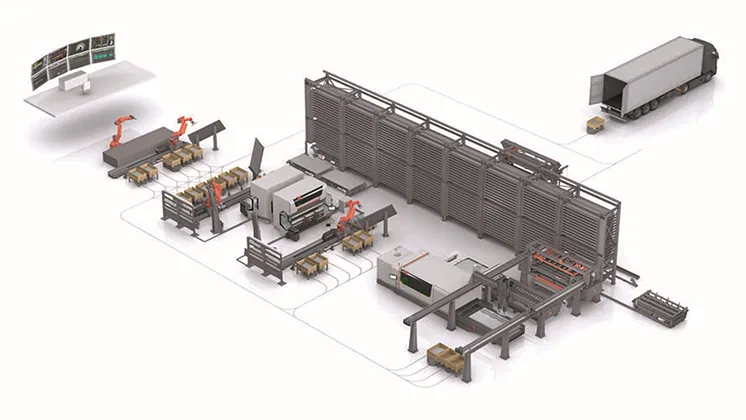
Data visualization and reporting solution in factory

Use of digital thread to transform how products are engineered, manufactured and serviced

Enabling full production efficiency by intelligent planning

Increase workers productivity

Predict heat exchanger fouling

Improve Reliability with Remote Monitoring, Condition-Based Maintenance

Optimized planning and scheduling through the entire supply chain

Monitor and improve product yield, productivity and asset utilization

Full quality control

Check the offer that fits your needs

Business Intelligence

Historical data analysis and visualization

Holistic view of the whole organization

High-level management data on business processes that can support decisions

Integration and contextualization of OT data with IT systems

Would you like to know more about the data visualization and reporting project delivery process?

Do not hesitate to contact us!

Our team of experts will guide you through the entire project, from defining your needs, defining your goals, to execute your implementation.

How do we deliver Data Visualization and Reporting solution?

1

Business Analysis of current situation

To realize the potential of BI and extract value from data, we need to have a good understanding of where we are, what we want to achieve and what is possible.

2

KPI / reports definition

Together with domain experts, we select the most important KPIs and report forms in those areas of your organization that can bring the most value to your business.

3

BI project implementation

We implement all necessary integrations between the selected BI platform and IoT (Internet of Things) / IT systems, and choose reports designed to make faster, more informed data-driven decisions.

4

The digital era of manufacturing

We have a suite of solutions designed to help you thrive in this digital era. We offer a variety of services that can be tailored to your needs, like Data Visualization and Reporting, Insights on Financial Processes, and Holistic View of the Whole Organization.

5

Get the big picture

Data visualization and reporting is a solution for manufacturing businesses. With it, you get insights of financial processes, from raw materials’ usage to sales, profit and losses in relation to manufacturing data. This holistic view of your company helps you to increase productivity and ROI with fast and easy-to-understand visuals.

6

Time is money

Industry data visualization and reporting is a time-saving solution for all your business needs. You will know at a glance which processes are working well or not, reducing costs and raising profits in the process.

7

Instant results

Drawing insights from all your data has never been easier - our reports are generated instantly with one-click. Simply import your data and you will receive a report within seconds reflecting the latest trends inside your company.

8

Focus on what matters to you

Automatically visualize key metrics such as time spent on tasks, total profit per customer, total profit per month or year - whatever you need to run your business smartly!

Discover the project delivery process solution

Average project duration 8-12 weeks

1

2 weeks

Business analysis and concept design

2

2-4 weeks

Turn concept into prototypes

3

2 weeks

UI/UX design and optimization

4

2-4 weeks

User ready solution