DevOps, AI and DORA Metrics – driving software delivery performance and productivity


Introduction
In the high-stakes arena of digital business, the ability to deliver software quickly, reliably, and securely is no longer just a competitive advantage – it is a prerequisite for survival. This reality has elevated DevOps teams from a niche movement to a mainstream practice at the core of modern software organizations. Yet many engineering teams still struggle to move beyond basic automation and truly optimize the entire software delivery process and value stream.
With industries racing to innovate faster, deliver secure digital experiences, and reduce operational risks, DevOps metrics have become the backbone of high-performing teams. But DevOps is not just about CI/CD pipelines or cultural change – measuring outcomes with DORA metrics is critical. These four DORA metrics (Deployment Frequency, Lead Time for Changes, Change Failure Rate, and Mean Time to Restore Service) provide a data-driven way to measure software delivery performance and identify bottlenecks across the value stream.
With the rise of Artificial Intelligence (AI), especially in coding, testing, and monitoring the production environment, new possibilities are unfolding. AI can optimize flow metrics, reduce lead time, lower change failure rate, and support development teams in achieving greater business value. The powerful combination of DevOps, AI, and DORA metrics is now redefining how engineering and operations teams implement modern software development, enabling high-performing teams to achieve unprecedented speed, stability, and customer trust.
Uderstanding DORA Metrics
Before improving performance, software organizations must first measure it. The DevOps Research and Assessment (DORA) team, founded by Nicole Forsgren, Jez Humble, and Gene Kim and later integrated into Google Cloud, studied thousands of software organizations to understand what separates high-performing engineering and DevOps teams from the rest. Their research identified the four DORA metrics, also known as the “Four Keys,” which strongly correlate with elite software delivery performance.
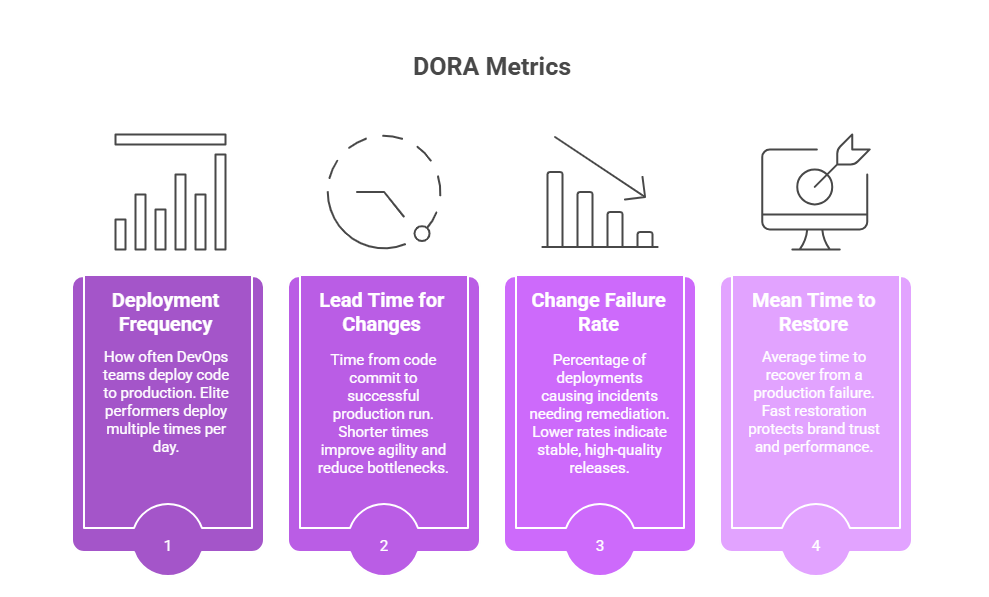
The four DORA metrics are:
- Deployment Frequency (DF) – How often DevOps teams deploy code to the production environment. Elite performers achieve multiple deployments per day.
- Lead Time for Changes (LT) – The time it takes from committing code to running it successfully in production. Shorter lead times improve agility, reduce bottlenecks, and accelerate feedback loops.
- Change Failure Rate (CFR) – The percentage of deployments causing incidents that require remediation. A lower CFR indicates more stable, higher-quality releases.
- Mean Time to Restore Service (MTTR) – The average time it takes to recover from a failure in production. Fast restoration protects brand trust and organizational performance.
These production stability metrics are now industry benchmarks. High-performing development and operations teams excel at all four: frequent deployments, short lead times, low failure rates, and fast recovery. Together, the four DORA metrics measure both throughput and stability, helping leaders align engineering performance with organizational performance.
How to implement DORA metrics in practice
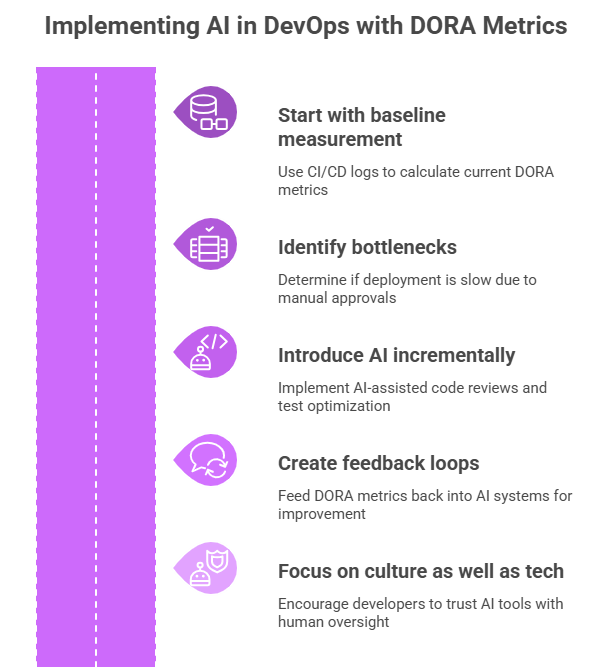
To implement DORA metrics effectively, software organizations must collect data across the entire software delivery process. This includes version control, CI/CD systems, monitoring platforms, and incident management. By integrating data sources, leaders can gain visibility into flow metrics and value stream management.
Example Tech Stack:
- Version Control: GitHub, GitLab, Bitbucket
- CI/CD: Jenkins, GitHub Actions, Spinnaker
- Monitoring & Incident Management: Datadog, New Relic, ServiceNow
- Orchestration: Kubernetes, Amazon ECS
Deployment Frequency & Lead Time for Changes
By linking deployment events from CI/CD pipelines with commit timestamps in Git, DevOps teams calculate lead time for changes and measure software delivery throughput. Elite performers achieve deployment frequency of multiple releases per day and lead time under 24 hours. Amazon, for example, deploys code every 11.7 seconds.
Change Failure Rate
By connecting deployments to incident management tools, organizations track which deployments trigger failures. Elite performers keep change failure rate below 15%, with leaders like Google maintaining under 5% using automated rollbacks and canary deployments.
Mean Time to Restore (MTTR)
Incident tools such as PagerDuty or ServiceNow record when issues occur and resolve. Elite-performing teams restore service in under an hour, protecting customer trust. Netflix, for example, applies chaos engineering to train teams for faster recovery.
The impact of each DORA Metric on development flow and productivity
Each DORA metric provides a unique lens into the health and efficiency of your software delivery process. Improving them has a direct and profound impact on developer productivity and business outcomes.
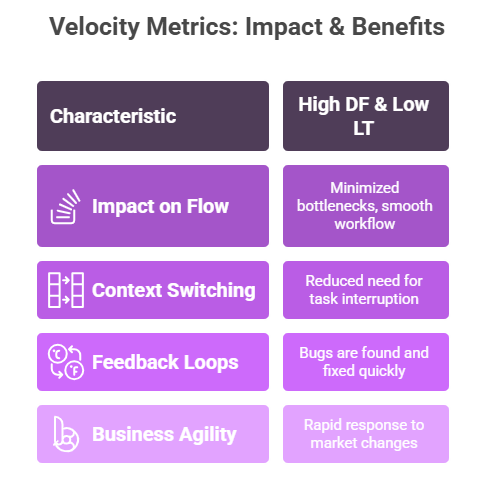
The velocity metrics: Deployment Frequency (DF) & Lead Time for Changes (LT)
Impact on Flow – These metrics measure throughput. A high DF and a low LT mean your team has minimized bottlenecks, wait times, and manual handoffs. Workflows smoothly from development to production. This is the result of a mature CI/CD practice, trunk-based development, and a culture of automation. Frequent deployments reduce batch size, lower risk, and accelerate feedback loops, while shorter lead times enable rapid experimentation and customer responsiveness.
Reduced Context Switching – Developers get feedback on their code within hours, not weeks. They don’t have to pause and work on other things while waiting for a lengthy release process.
Faster Feedback Loops – Bugs are found and fixed quickly because the code is integrated and deployed frequently. This is far less costly than discovering a bug months after it was written. Faster feedback prevents wasted effort and accelerates learning cycles.
Business Agility – The business can respond to market changes and customer feedback with astonishing speed. A competitor launches a new feature? You can ship a counter-feature in days, not months.
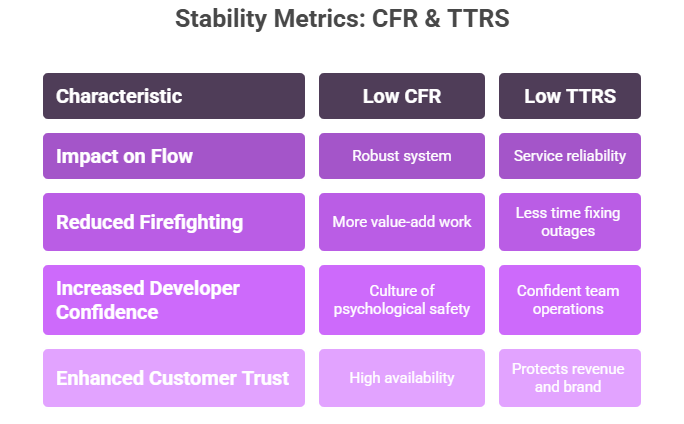
The Stability Metrics: Change Failure Rate (CFR) & Time to Restore Service (TTRS)
Impact on Flow – These metrics measure the quality and resilience of your process. A low CFR and a low TTRS mean your system is robust. Failures are rare, and when they do happen, they are not catastrophes. They are blips that are handled efficiently. Lower CFR means better quality and less time spent fixing production issues, while short MTTR ensures service reliability, protecting brand trust and revenue.
Reduced Firefighting – When failures are rare and recovery is fast, engineers spend less time in „hero mode” fixing production outages and more time on value-add work like building new features.
Increased Developer Confidence – A low CFR creates a culture of psychological safety. Developers are not afraid to deploy because they trust the system (tests, feature flags, CI/CD) to catch problems. This encourages more innovation and higher velocity. Teams operate with confidence, knowing failures won’t cripple operations.
Enhanced Customer Trust – High stability directly translates to high availability and a better customer experience, which protects revenue and brand reputation.
The core Insight: You cannot optimize for velocity at the expense of stability, or vice versa. The goal is elite performance and excelling at all four metrics simultaneously. This is where AI becomes the ultimate catalyst.
Applying AI to enhance DORA metrics
Artificial Intelligence (AI), including machine learning (ML) and generative AI, can significantly improve software delivery performance. When applied strategically, AI automates complex decisions, predicts risks, and augments engineering teams, directly strengthening the four DORA metrics.
Boosting Deployment Frequency & Reducing Lead Time for Changes
As codebases grow, long test cycles slow down releases. AI-driven test selection runs only the most relevant tests, cutting build times from hours to minutes. This shortens lead time for changes, increases deployment frequency, and improves overall flow metrics. Netflix, for instance, uses predictive test selection to support thousands of daily deployments, while large financial organizations reduced regression testing from 12 to 2 hours with AI, accelerating DevOps performance.
AI-assisted code reviews further speed up delivery. Tools like GitHub Copilot or GitLab Duo suggest fixes, detect vulnerabilities, and automate pull request summaries. This reduces bottlenecks and improves quality assurance before human review.
Lowering Change Failure Rate (CFR)
AI enables predictive risk analysis by learning from historical deployments. Risky releases are flagged for manual review or canary testing, lowering the change failure rate. Companies like Uber apply ML-based canary analysis to ensure more successful deployments, while healthcare SaaS vendors have reduced CFR from 20% to 8% with AI anomaly detection.
AI-powered security scanning strengthens production stability metrics by detecting subtle vulnerabilities earlier, reducing failures and protecting organizational performance.
Reducing Mean Time to Restore (MTTR)
AI-driven AIOps platforms such as PagerDuty Operations Cloud correlate thousands of alerts to identify root causes in real time. This reduces MTTR from hours to minutes and protects customer satisfaction.
Automated remediation and self-healing systems restart services, roll back faulty deployments, or auto-create tickets without human intervention. Leading e-commerce providers use AI to cut CFR by 60% and restore production in under 10 minutes during peak demand.
The future flow: an AI-Augmented DevOps lifecycle
The convergence of DevOps, DORA metrics, and AI will likely define the next decade of software delivery. Elite-performing teams will combine automated pipelines with intelligent AI-driven decision-making, reaching new levels of reliability and speed. Imagine a fully AI-augmented development flow:
- A developer writes code with an AI pair programmer that suggests entire functions.
- Upon commit, an AI predicts the risk of the change and selects the optimal test suite to run.
- An AI reviewer provides instant, preliminary feedback on code style and security.
- The deployment is automatically deployed to a canary environment, where an AI compares its performance in real-time, rolling it back instantly if anomalies are detected.
- When an unusual incident occurs, an AIOps tool correlates the data, diagnoses the root cause, and either executes a fix or provides the on-call engineer with a precise diagnosis and recommended solution.
- DORA metrics are updated in real time, guiding leaders instantly.
- Failures are detected and resolved autonomously within seconds.
This is not science fiction. The building blocks are available today.
Conclusion
DORA metrics measure what matters most in software delivery performance – deployment frequency, lead time for changes, change failure rate, and mean time to restore service. These four DORA metrics provide leaders with a proven framework to align engineering teams, DevOps teams, and development and operations teams with business value.
Artificial Intelligence accelerates this journey by helping software organizations implement DORA metrics more effectively, reduce bottlenecks, and improve both velocity and production stability metrics. From automated testing to AI-driven incident management, the opportunities are immense.
For CTOs, CIOs, and engineering and DevOps leaders, the challenge is not only adopting AI tools but aligning them with value stream management and DORA-driven strategies. Done well, this creates a culture of continuous improvement, where development teams and operations teams achieve elite software delivery performance, accelerate organizational performance, and deliver greater customer value.