IoT Data Visualization

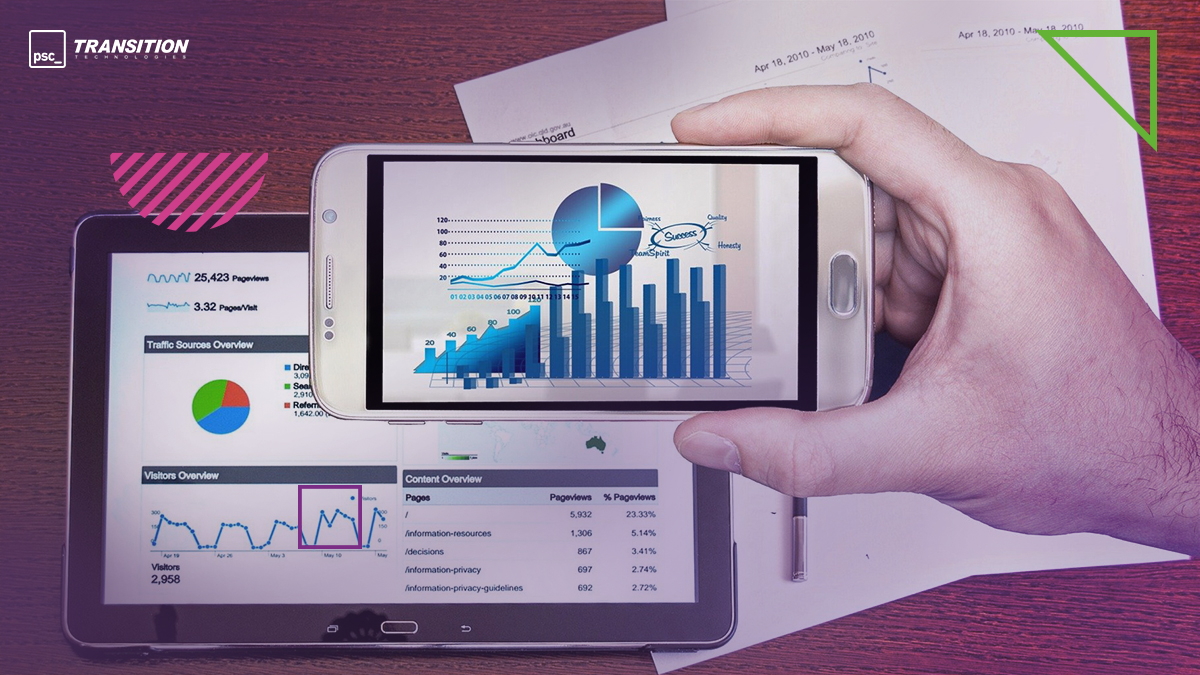
Internet of Things systems have one huge advantage – they can collect lots of data. Temperature, items produced, amount of remaining liquids, humidity, machine uptime, damaged products, vehicle routes, electricity used. Based on this, we can get even more value by calculating KPIs to indicate how close to perfect our system is. Going manually through an endless stream of numbers changing every couple of hours is impossible and inefficient. The simple solution is to visualize the data by using a carefully selected chart type, that will exponentially increase its value. In this article, I want to show you the benefits of good data visualization and explain how it can be applied in your solution.
What is data visualization?
The concept of data visualization is very simple and literally means a graphical representation of gathered information. It is not rocket science, but if not done properly it can do more harm than good. Multiple disciplines of science and art came together to create probably the most effective way of presenting data for end-users. The main requirement for good visualization is to present the same data, delivering the same amount of information to a person looking at it, but in a more attractive form. This technique is used all around us: on the news when showing election polls, in your banking application, in the advertisement to impress you with how much this new product is better than the old one, in the stock market and probably most used in last year – how is the pandemic going.
The key question is why is it so popular? Mainly because it is much less time-consuming to look at a simple bar graph with past months expenses than to read through a table with the same data and compare it in our heads, using just the imagination. In advertisement and TV, it’s even more important to save as much time as possible – nobody is going to display data sheets for minutes or even hours during the commercial break. Furthermore, displaying a graph for a few seconds gives most users more useful information than showing the same data in the raw form twice, thrice, or even more times. That’s why advertising agencies love all kinds of charts so much.

How data visualization works?
Now that we know what data visualization is and why it is so popular, let’s focus on how it works. There are dozens of ways of representing data. It can be a simple bar graph showing the amount of rain per month, but also, in a more detailed version – a line graph with daily amounts. This data can be combined with an average temperature as the second line or second set of bars. A graph combining those two can give us information on whether the month that we are looking at was cloudy, cold, rainy, and typical for autumn or if it was sunny and hot, but there was a huge storm. To do so, we would need not just the temperature and rain amount readings, but also a timestamp or set interval of measurements. This data, of course, needs to be gathered and stored. In the old days, it would be probably just a paper report filled by hand. Nowadays, we can just quickly transfer it to the database, which can be accessed at any time by millions of users simultaneously. Lastly, we need some kind of software that will visually present the data as a graph, whether it will be a mobile app, web page, or desktop program. This way we get a ready chart that we can use for fast and easy data analysis.
How data visualization affects IoT?
It’s clear that data visualization has lots of advantages in everyday life. But how can improve the performance of IoT solutions? As a network of multiple machines exchanging and sending collected data to storage, IoT solutions have a lot of potential for data visualization. The right usage of gathered information can help with making key business decisions, but it has to be presented in a form that is easy to understand and analyze. As I explained earlier, data visualization is perfect for that, and it has been used for many years to fit multiple needs. As IoT is constantly growing, it’s only natural to incorporate known and trusted solutions from other business areas. The digital aspect of said systems works in favor of using methods like data visualization within them. The data is easily accessible and can be gathered directly from machines, using the same services that enable its storage, which increases the value of IoT applications.
IoT systems have the capability for real-time data processing, a result of this process can be presented in the same application, giving users more opportunities for increasing overall system performance. Keeping the performance of the system on the desired level is an important part of manufacturing. Commonly used performance indexes along with graphs can help with achieving set goals.

Data visualization using ThingWorx
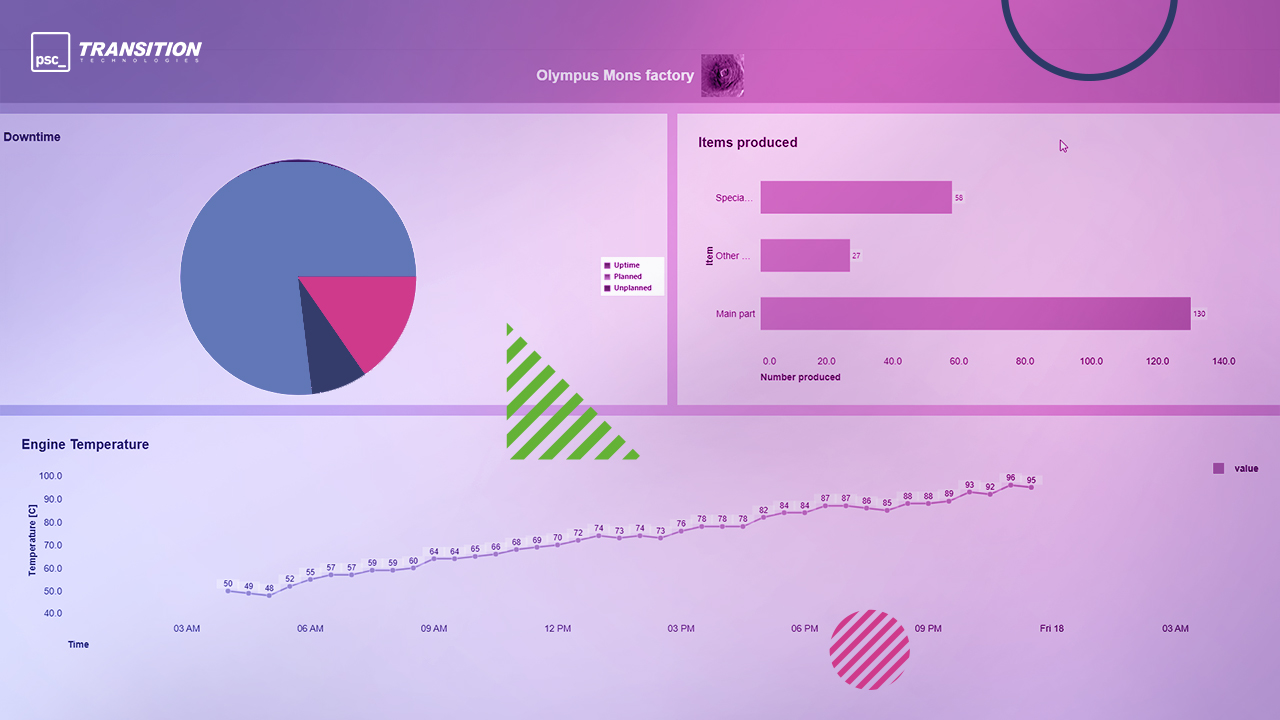
With an understanding of data visualization, and its benefits let’s focus on how it’s done in ThingWorx. Firstly one of this platform’s characteristics is flexibility. The decision on using different data sources or different databases doesn’t mean that the whole project needs to be restarted. With the ThingWorx logic of your system, everything can be done in a simple way using services such as planning, simulating different scenarios, managing shifts and machines, controlling whole production chains. Furthermore, the interface can also be adjusted in ThingWorx – whether it is a panel looking like a nuclear power plant control board, a futuristic dashboard, or a simple, nice-looking one without too many distractions.
All of this can be done. Out-of-the-box visualization possibilities are immense – all popular and most used chart types, time-series ones, bubble charts, bar charts, pie charts, gauges looking like those from real-life old trains or futuristic ones, sliders, value. It’s all available to be used from the very beginning. If you need any kind of widget that is not available within your platform, it can be easily added.
An experienced developer will take care of the process to assure the most efficient use of different libraries, designed specifically for data visualization and other specialized tasks. If you are used to some kind of display style or measurement device that is specific for machines used in your factory, there is an option to create a widget that will imitate it. Implementation of this kind of project is a flexible and understandable process. End-users feedback can be applied from the early stages to create applications fulfilling all requirements.
Summary
Nowadays, there are terabytes of data collected each minute or even second. There are so many devices and machines in the whole world that even if each human would monitor a few of them, there still would not be enough of us. This data is both valuable and worthless because of its volume, so a well-thought visualization might be very helpful. With the right tools, this enormous amount of information can give you a big advantage. We, Transition Technologies PSC, are professionals in this matter, and we can make dashboards you haven’t even dreamt of. Contact us now!