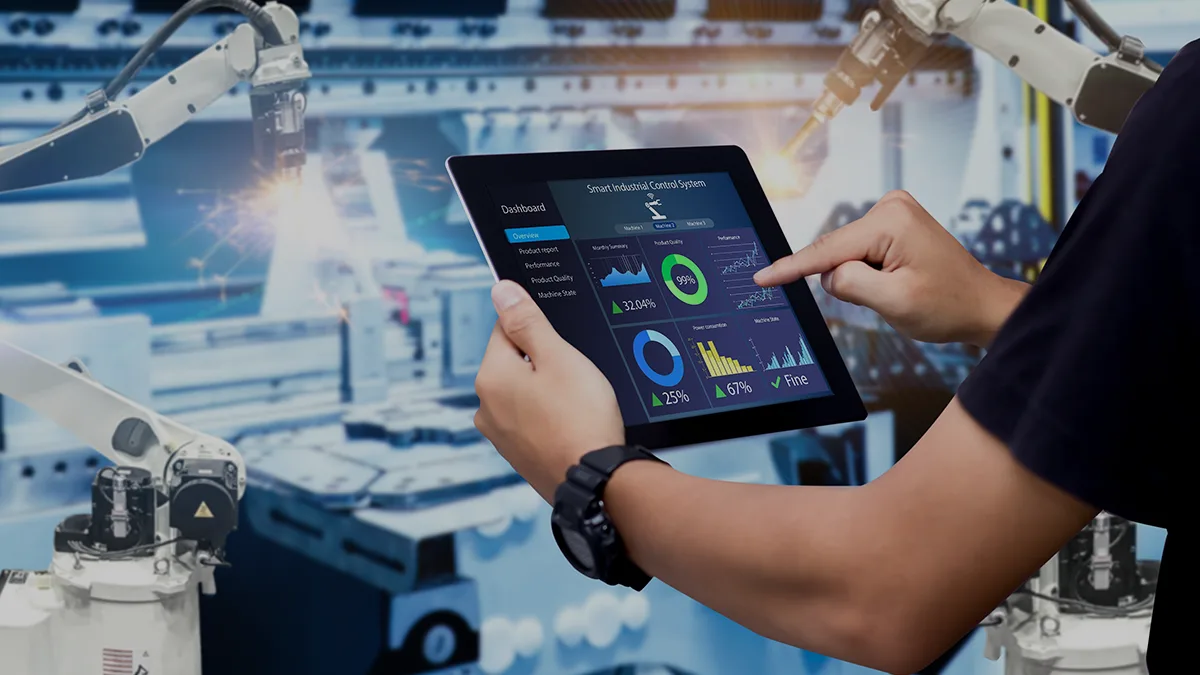
Lesson Learned Explained: Data visualization in components manufacturing for automatics
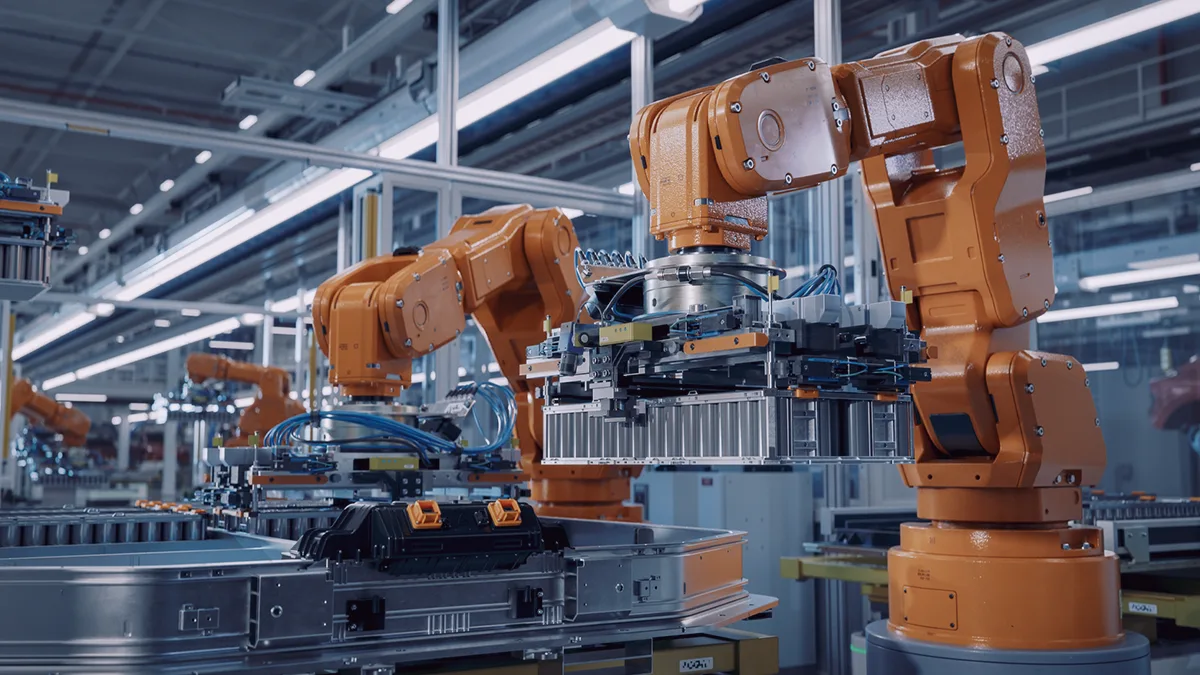
A global company in the electrical accessories manufacturing industry used in automation faced the challenge of improving key performance indicators (KPIs), particularly increasing the availability and efficiency of production cells. Each workstation involved multiple stages of assembly and production across various positions and locations, requiring a coordinated approach to managing work, materials, and proper planning.