5 steps to increase energy efficiency for Manufacturers


According to the German Federal Statistical Office, energy consumption by the industry for the production of goods hardly changed between 1995 and 2019. In 2019, it amounted to 3,874 petajoules. This means that it remains at the same level as in previous years. Germany plans to halve its primary consumption of energy by 2050, with the industry having to take part. In the era of the energy crisis, the drive to improve corporate energy efficiency is entering a new level.
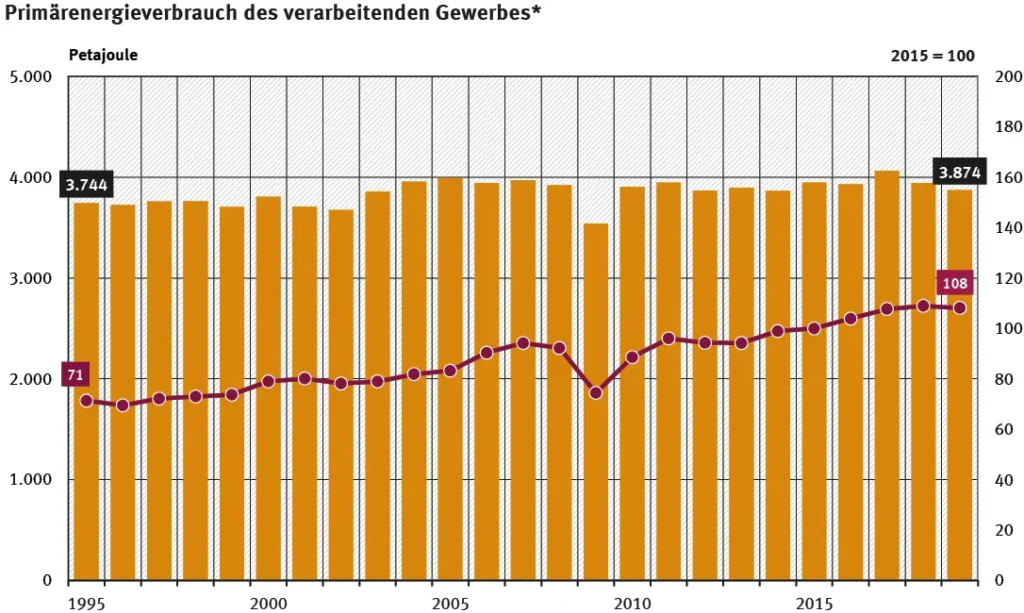
Source: Statistisches Bundesamt
Sustainability is no longer an option
Today, many companies are looking at how they can improve their efficiency in the area of energy use, how to conduct a detailed review of their utilities to reduce annual energy consumption, and systematic monitoring of what the savings are.
Without an overall strategy for new energy management systems in manufacturing, it is nearly impossible to drive change in companies and drive global and unified initiatives for energy-saving improvements. Only a dedicated energy team supported by the entire organization can develop a strategy, conduct an energy audit and establish an energy efficiency plan to implement appropriate measures. Our approach to project implementation can help companies avoid excessive energy costs, despite rising prices.
5 steps to improve energy efficiency
1. Measure utilities’ consumption
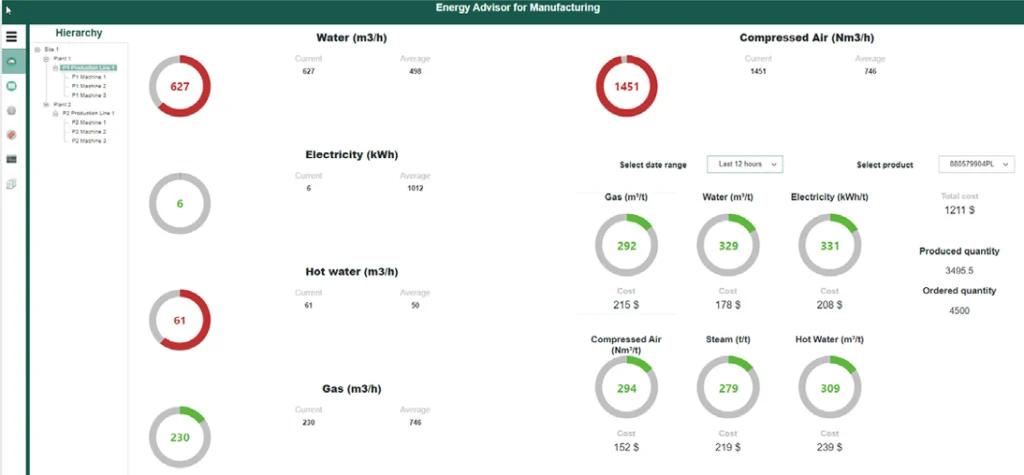
Transparency plays a key role in manufacturing, as it is impossible to optimize something that is not visible. Through transparency, awareness can be increased and knowledge can be built, allowing for informed decisions based on data and insights.
Good visualization forms the basis of a central data source and allows for defining specific energy-saving projects. Without this step, the chance of success decreases significantly.
360° view of energy
In today’s complex manufacturing processes, data from electricity meters is not enough. It is necessary to meaningfully correlate metering data with other information, such as data from production planning, the manufacturing facility, or the process.
Only this approach provides a complete picture and can help optimize the areas with the highest energy use in production facilities.
2. Identify significant energy use SEU (Significant Energy Use).
This involves identifying the main consumers (SEUs) and marking their consumption capacity. It is important to record 80% of the system output. This can be done through simple data analysis, as SEUs are usually known within the company.
The knowledge available in the company is backed up by numbers, and the proof is provided to the auditor, contact person, or customer.
3. Define critical operational parameters

Critical operating parameters are primarily those factors that can be actively managed during operation. Strict correlation is determined by regression analysis. These critical operating parameters must be defined and included in key figures and operational management. These parameters are further analyzed in regression analysis and correlated with further data.
The results of regression analysis, which take into account operating parameters, should be carefully examined for their savings potential and simulated with future consumption in mind. There are various factors that can have a varying impact on the savings potential of a given SEU.
4. Analyze regression and identify key figures

The method of analysis by linear regression is a procedure to find a description of a variable y as a linear function of other variables (minimum of one – x) t.i.e. y=f(x). Thus, linear regression can be used to describe the dependence of the expected variable y on the variables linearly independent of it. Thanks to this, we can recognize with which parameters the predicted variable correlates, and even extrapolate the set to predict values, and therefore future results.
The basic model that implements the linear regression method is to look for the straight line with the smallest deviation from the actual measurements (both positive and negative). However, this is a way for the described points that brings a great simplification, because it is difficult to approximate the results of actual measurements on a graph, with sufficient accuracy, with a straight line.
In energy consumption control systems, the linear regression method is useful for selecting values that are linearly independent but affect key parameters of power consumption (usually converted per unit of output). In this way, it is possible to narrow down the set of variables important to monitor, such as temperature or pressure, for example, which affect the energy usage of the selected consumer.
Identify the necessary operational management
Energy-efficient operational management must be carried out for each relevant component of the receiver system. Such operational management can, for example, be anchored in a work instruction or functional description. This operational management must be coordinated with the responsible shift or plant managers.
Operators with significant influence on reducing energy consumption
People who do their work on the shop floor are usually also a factor in reducing energy consumption. Therefore, they should be made aware of their tasks in order to keep energy consumption as well waste energy costs as low as possible. Specific tasks and solutions for them should be described (e.g., if a predetermined limit is exceeded, measure X should be applied).
5. Implement selected projects
Work out improvements in energy efficiency
Any opportunity for improvement must be visible and documented. Regression analysis can be used to prioritize specific projects by forecast and predicting potential savings. If all of this is put into the context of the necessary investments and schedule, then priorities can be set very quickly.
Ideally, these improvements can also be entered into the CIP database. If the improvement proposal is approved, it will be included in the designated catalog of measures for this important consumer. It is important that these decisions are made transparently and that the originator receives appropriate feedback.
Identification of training needs
Plant changes must be explained to operators in a way they can understand. Therefore, previously developed steps should be recorded in a training plan that serves as training for the relevant people in the area.
Establishment of project reporting
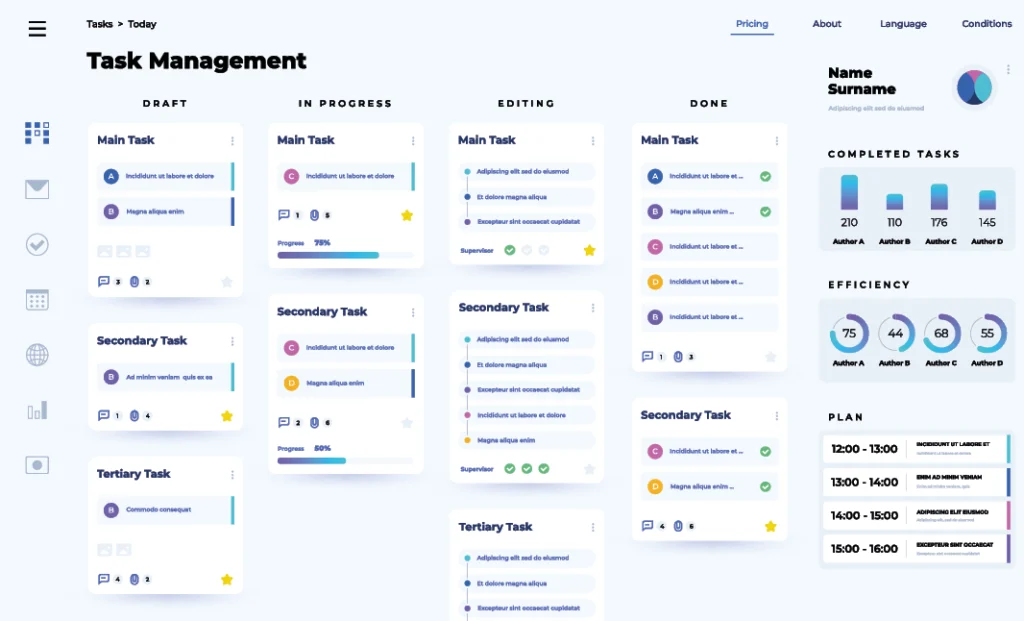
Energy savings and planned operations must be translated into projects. The production department focuses on projects, not energy savings. Therefore, it is important to transfer projects to a project management tool and track and organize activities there. At the same time, the actual energy savings from individual projects must be visible to the energy manager. So integrating the project management tool with data analysis is key.
Conclusions
There can be many reasons to focus on energy savings:
- the need to increase competitiveness in a demanding market,
- the need for compliance and reporting requirements,
- the desire for a positive environmental impact or legal requirements.
Regardless of which one you prefer, the key is to have a good approach and choose the right initiatives, the best areas, and tools in terms of energy consumption. Performing energy audits, using energy-saving tips, and introducing new technological solutions can make a significant contribution to improving your consumption efficiency and reducing energy costs.