Root Cause Analysis in Manufacturing: How Machine Learning Traced Unstable Casting Quality to an HVAC Outlet

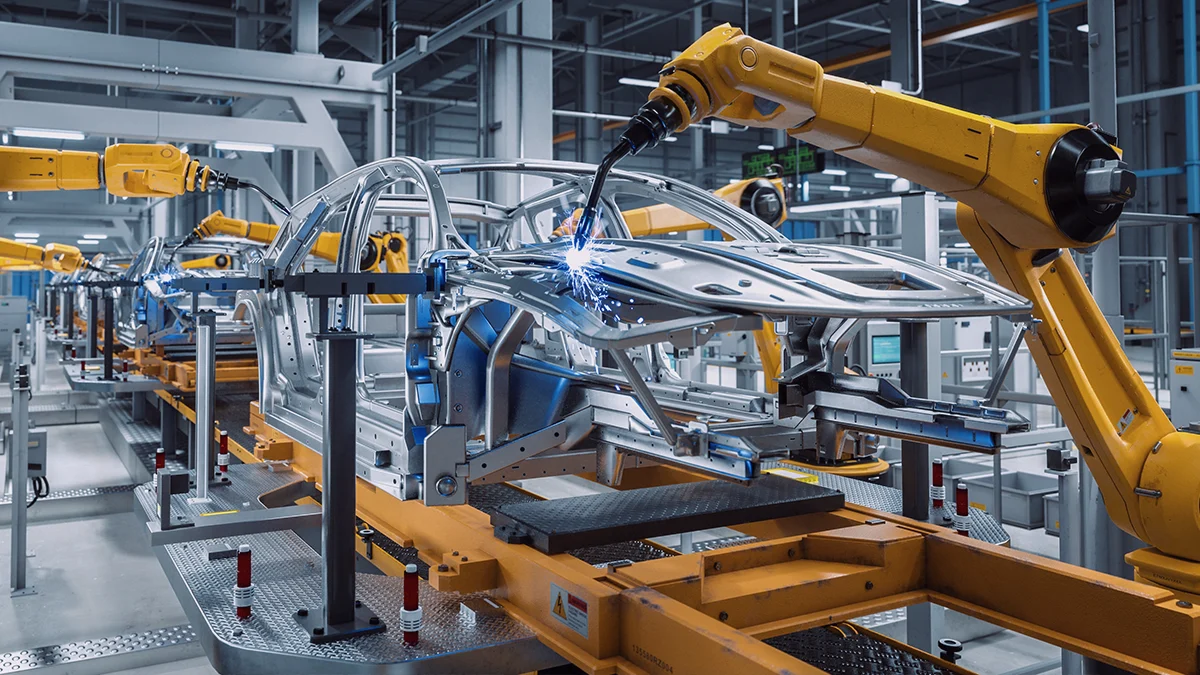
Root cause analysis in manufacturing usually starts inside the process: machine settings, materials, temperatures and cycle times. In this automotive project, the cause of unstable casting quality sat outside the process altogether. Machine learning applied to all available plant data linked the quality drops to direct airflow from an HVAC outlet near the cooling zone. Shielding that area from the airflow removed the variability.
Below we walk through the case step by step and share three lessons for manufacturers who want to use data in root cause analysis. The project is part of our wider digital manufacturing work, where production and quality data are used to remove losses at their source.
| Case at a glance | Details |
|---|---|
| Industry | Automotive, metal casting |
| Problem | Unstable quality of castings, most visible in the casting and cooling zones |
| Approach | Integration of machine and sensor data, correlation analysis with an AI/ML engine |
| Root cause | Direct airflow from an HVAC outlet changing the cooling curve of castings |
| Fix | Shielding the cooling area from direct airflow |
| Result | Quality variability caused by uncontrolled cooling conditions eliminated |
The challenge: unstable casting quality in an automotive plant
An automotive manufacturer needed better visibility of its production to improve the quality of finished products. Quality varied most in the casting and cooling zones, and the client’s experts had struggled for a long time to explain why.
The goal was to monitor production continuously and correlate quality data with production data. That way, the factors behind quality deviations could be identified with evidence rather than assumed.
Why traditional root cause analysis missed the cause
Classic methods such as 5 Whys or fishbone diagrams start from hypotheses that experienced engineers already hold. They work well when the cause sits among the parameters people expect to matter, and less well when it sits outside them.
Expert analysis tends to focus on the production process itself. In this plant, however, the process data showed no definitive link with product quality. The problem was not in the process, which is exactly why intuition alone could not find it.
The approach: connecting machine, sensor and quality data
With the support of TT PSC, the company integrated data from machines and sensors on the production floor and gave an AI/ML engine access to the full history of process and plant measurements. The collected data was visualised and analysed for correlations that could explain the quality issues. The same setup enabled real-time monitoring and analysis, so the team could respond quickly to any irregularities.
This is the foundation of predictive quality analytics: collecting enough context around production to explain, and later anticipate, quality deviations. Bringing machine and sensor data into one place is first a connectivity task, described in our practical guide to industrial connectivity, and then a job for industrial analytics.
What machine learning found: an HVAC outlet near the cooling zone
Even with the full dataset, the analysis found no definitive link between process parameters and product quality. Statistical machine learning methods, applied to every available parameter, pointed to a correlation with something that seemed unrelated to production: the outlet of the HVAC system.
Quality dropped when the air conditioning was running. Direct airflow from the outlet reached the area where castings cooled and changed their heating and cooling curve. The real source of the problem was the plant environment, not the production process.
This is where root cause analysis with machine learning adds the most value. An algorithm makes no assumptions about which variables should matter, so it tests all of them, including those an expert would set aside.
The fix: shielding the cooling area from direct airflow
Once the cause was known, the fix was simple. The team shielded the cooling area from direct airflow, so the air conditioning could no longer affect how castings cooled.
This eliminated the quality variability caused by uncontrolled cooling conditions and significantly improved the quality of finished products. A simple physical change solved a problem that process-level analysis could not explain.
Three lessons for root cause analysis in manufacturing
- Let algorithms support decisions. Machine learning analyses data that expert intuition would usually overlook, which widens the search beyond the obvious suspects.
- Keep domain experts in the loop. The knowledge of industry experts and production specialists is essential for using machine learning effectively, from selecting the data to judging what a correlation means on the shop floor.
- Make results easy to act on. Even complex algorithms should deliver findings that engineers and operators can understand and put into practice.
The project worked because it combined human expertise with analytical tools. Neither would have found the cause on its own.
Where data-driven root cause analysis fits in digital manufacturing
Data-driven root cause analysis rarely stays a one-off exercise. Once machine, sensor and quality data are connected, the same foundation supports predictive maintenance, OEE monitoring and other Industry 4.0 use cases. Our step-by-step digital transformation roadmap shows how to sequence these initiatives, and the AI for Manufacturing page explains where machine learning fits on the shop floor. If you are deciding which type of AI suits a given problem, read our comparison of predictive AI and generative AI in manufacturing.
FAQ: root cause analysis in manufacturing
Root cause analysis in manufacturing is a structured way of finding the underlying cause of a defect, failure or performance loss, so that it can be removed rather than corrected again and again. Common methods include 5 Whys, fishbone diagrams and 8D, increasingly supported by data analysis and machine learning.
More examples from our digital manufacturing projects
- Systems integration and data modelling in semiconductor manufacturing
- Why data collection and storage decide the success of predictive maintenance
- Improving KPIs on semi-automated FMCG production lines
- Digitalising reporting processes in glass packaging manufacturing
- Data visualisation in components manufacturing for automation