Machine Learning & ThingWorx vs COVID-19

The evolution of artificial intelligence, as well as machine learning has gained momentum in the last few years. The constant drive to increase the computing power of computers has given the opportunity to use algorithms and mathematical apparatus created in the second half of the 20th century on an unprecedented scale. With the imminent arrival of a commercial quantum computer, we can slowly become afraid of scenes from the movies with Arnold Schwarzenegger as Terminator. However, without going too far into the future, and focusing on the present, I decided to check the possibilities offered by the technology available today and whether it can be used to predict the spread of COVID-19 disease.
What is machine learning?
There are many definitions of machine learning on the web: ideological, strictly mathematical, and even philosophical. Trying to define this term myself, I found that it is best to focus on comparing machine learning with classical programming.
1) Comparison of machine learning with traditional programming
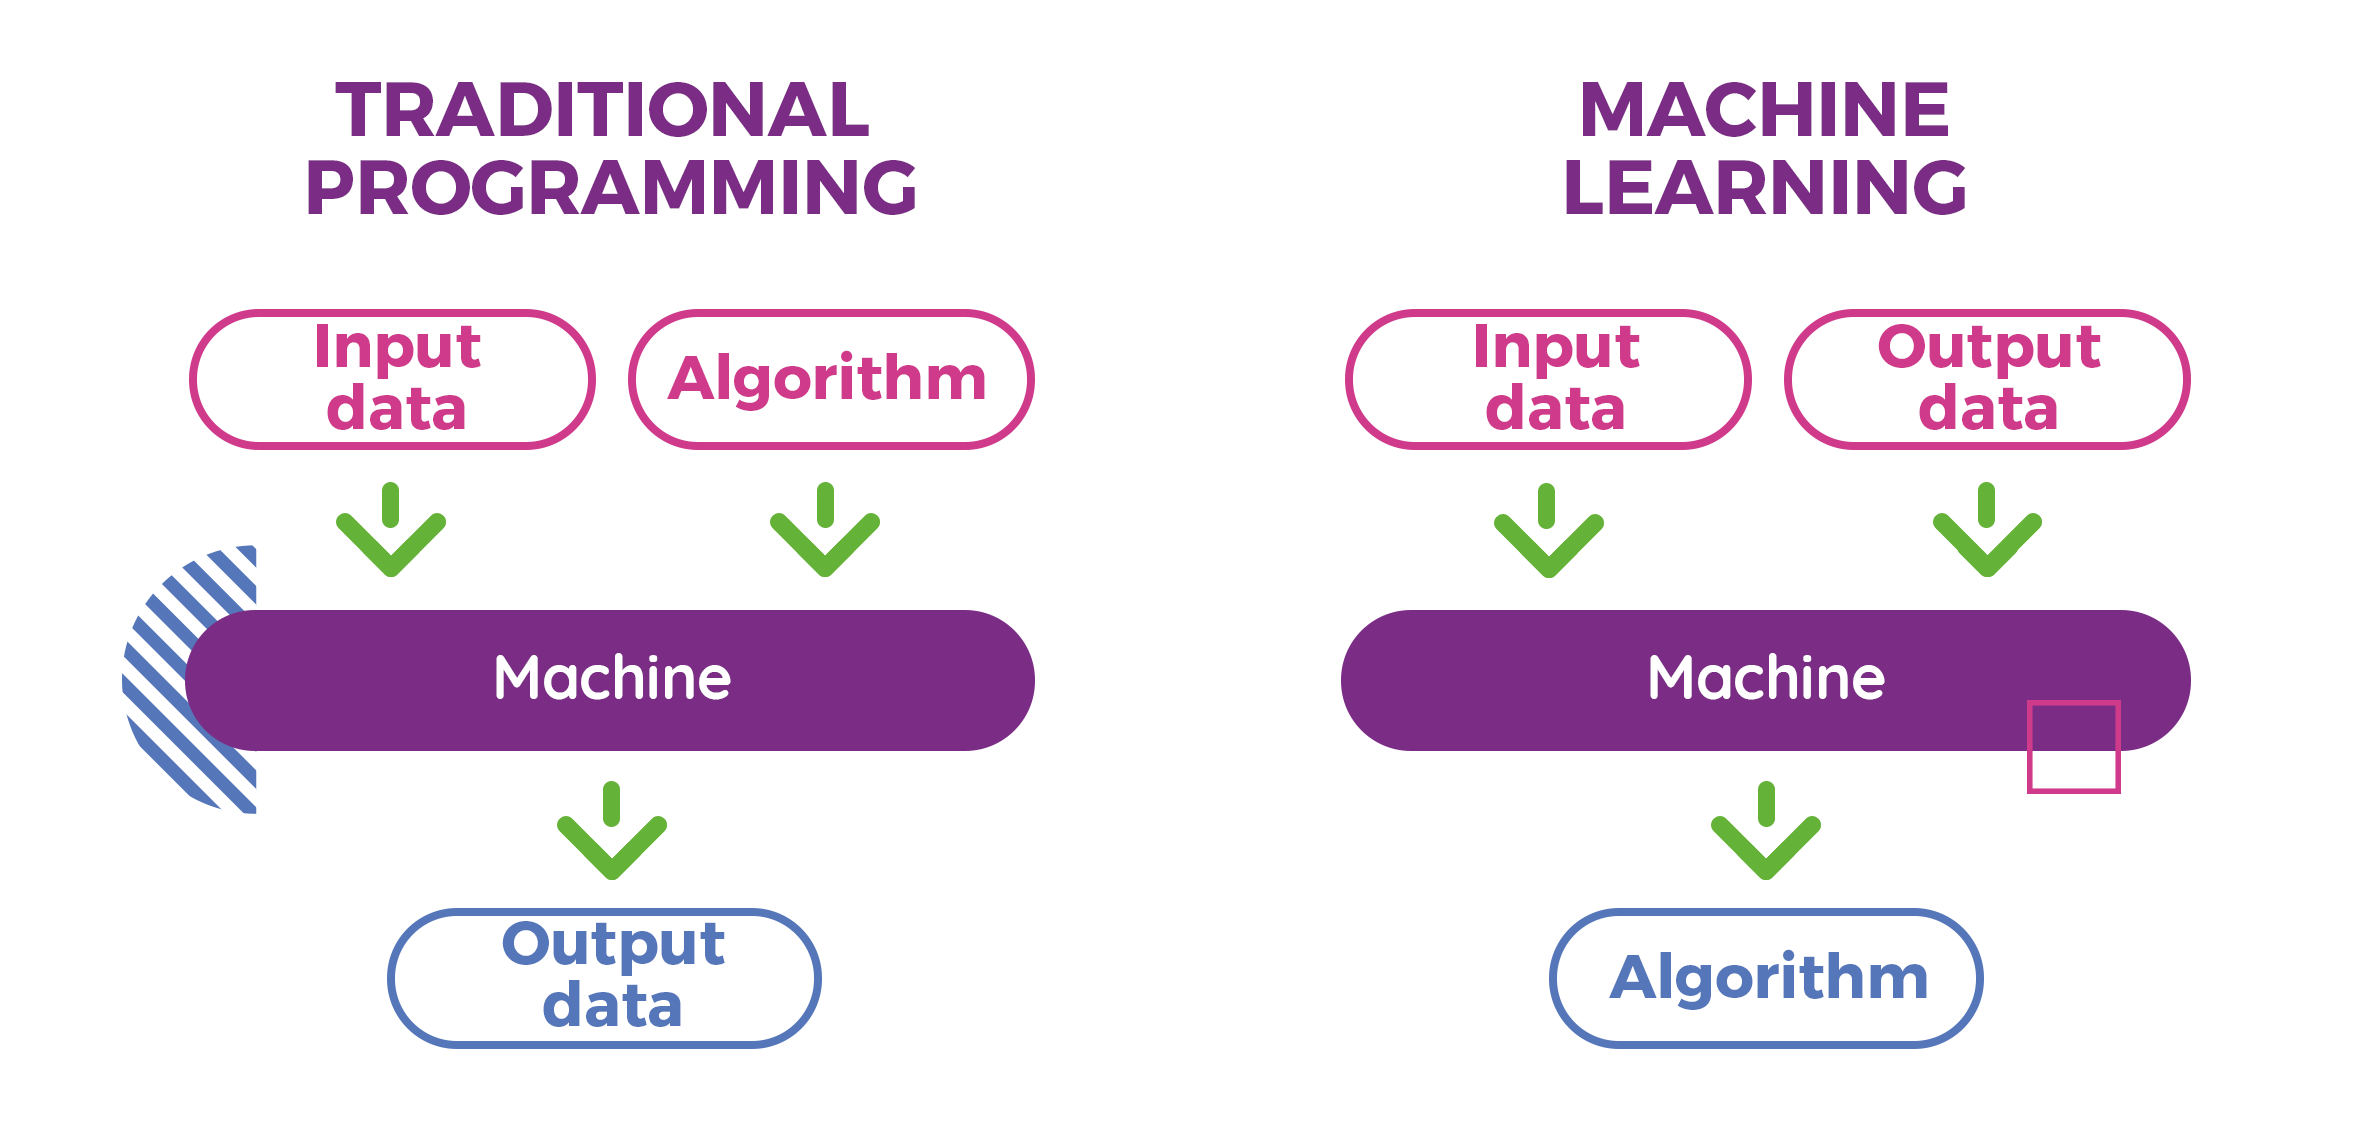
Apart from all kinds of software development methodologies (object-oriented, structural, functional, etc.), most of us know and understand what traditional programming is all about: having input data and using an algorithm suitable for solving a particular problem, we get results – output data.
For example: the algorithms used in banking are predefined, and due to their precise implementation we do not worry whether the internet transfer we send will surely reach the recipient and the balance on our accounts will match.

2) Sample algorithm in traditional programming
So it seems that by creating the correct algorithm we are able to solve any task, and this is absolutely true. However, the problem arises when creating such an algorithm is not trivial, and sometimes even impossible.
A good example of such a problem (staying in the financial zone) would be an algorithm predicting the exact prices of companies’ shares on the stock exchange with anticipation – there is no rigid framework and rules here that would describe the behavior of the share price. The final price is influenced by hundreds if not thousands of different variables, sometimes single unpredictable decisions of presidents or even natural disasters. It is completely impossible to design and implement such an algorithm which would precisely solve this problem. Moreover – even if we would like to make an attempt to create an algorithm that would at least roughly determine the behavior of the future price of a given asset (e.g. return the information whether the price will increase or decrease tomorrow) – it would be a very breakneck task, requiring a lot of domain knowledge from brokerage fields and very complicated dependencies resulting from the multitude of variables that would affect the result.
Here, machine learning comes in handy, which is in a way a reversal of the problem area – instead of calculating specific output values with the help of a specific algorithm (as in traditional programming), let’s try to find an algorithm that will reproduce the output data we know as accurately as possible. The ingenious in its simplicity approach, supported by solid mathematical equations, opens up unlimited possibilities of solving problems that would be difficult and in most cases impossible in the traditional way.

3) The machine learning scheme
In short, machine learning is nothing more than finding an algorithm that solves a specific problem through the best possible representation of model input and output data (the so-called training data), without the need to design or implement this algorithm.
Machine learning capabilities
Machine learning is used to solve a wide range of problems which are divided into three main types depending on the nature of the task:
- Supervised learning
- Unsupervised learning
- Reinforcement learning
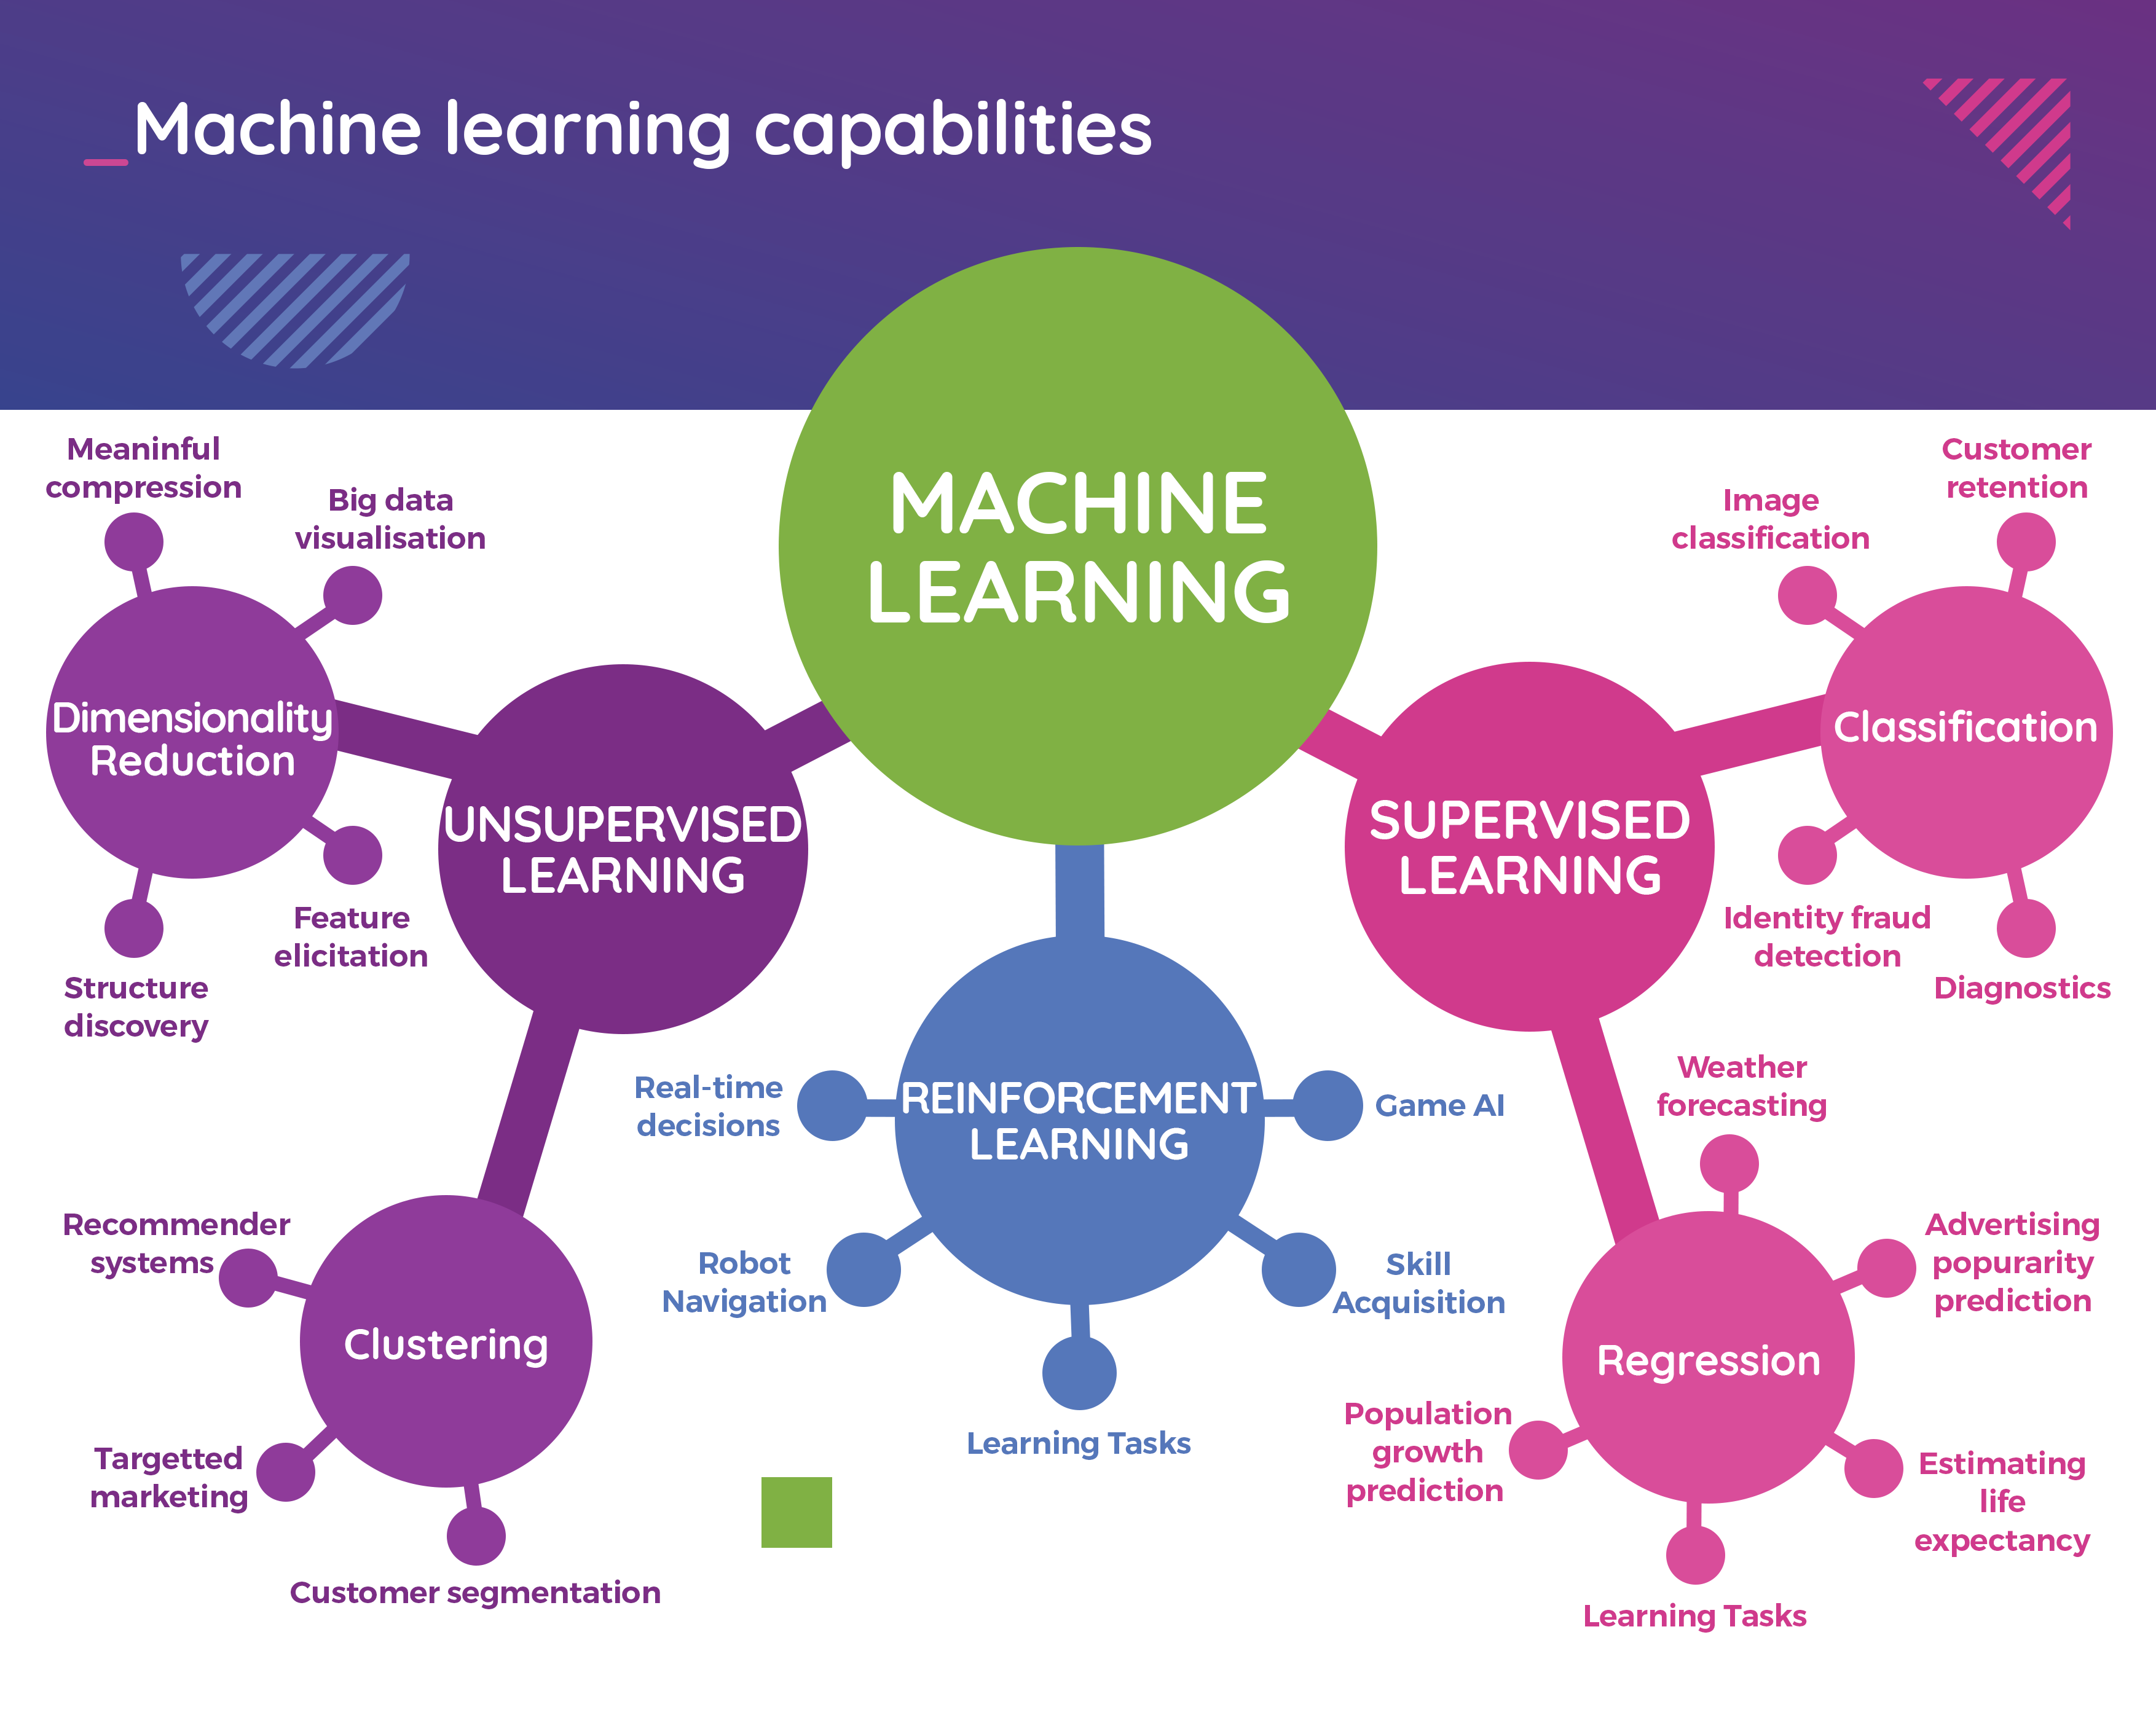
4) Machine learning capabilities
Within the context of this article, we will focus on the most popular supervised learning so far, which is most often used in the problems of data classification (e.g. what is present in a given image, OCR (optical character recognition), forgery or spam detection, etc.) and – what will be most interesting for us – regression (broadly understood forecasting, such as weather forecasting or the aforementioned share price).
Note that from year to year there is a very important development of reinforcement learning, especially in the context of solving real time decisions problems (e.g. autonomous cars or games of unimaginable complexity like chess or GO).
Artificial neural networks as a multi-purpose tool
Interestingly, most office workers who come into contact with spreadsheets (e.g. Microsoft Excel) on a daily basis often unknowingly use the benefits of machine learning to solve regression problems – for example, by creating a trend line on the data set depicted in the chart. Within a few seconds (mouse clicks) a straight line (linear regression) or a polynomial curve of any degree (polynomial regression as in the figure below) can be analytically determined.

5) Polynomial regression in Microsoft Excel
Linear or polynomial regression is an example tool used in supervised machine learning. With the prescribed straight/curve pattern we can easily make a forecast of future values. However, this is not always an optimal solution (as can be seen from Figure 5) and there are many other techniques that can be used to solve a specific problem. Some of them have been collected in the following graphic:

6) Machine learning methods and techniques
It cannot be overlooked that all the problems addressed by machine learning (not only those related to regression and classification, but also others such as clustering) can be successfully solved using Artificial Neural Networks.

7) Comparison of biological and artificial neuron
Neural networks are a mathematical representation of the biological system of neurons in our brains. A single neuron, like the real one, processes signals – in a more mathematical language it performs the function of which transforms the input signal vector up to the output signal :

A detailed description of the operation and learning process of the neuron (selecting the appropriate values of weights ) is definitely a material for a separate, more technical article and I won’t go into further details here. What’s most important at this point is that single neurons can be connected together in networks with different topologies depending on the type of problem we want to solve, and the most popular network architectures include:
- Multi-layer perceptron, MLP
- Universal, simplest network topology that can be used to solve any problem
- Convolutional Neural Networks, CNN
- Networks that are based on a mathematical convolution, most commonly used in 2D and 3D image processing
- Recurrent Neural Networks, RNN, including Long-short-term memory neural network (LSTM)
- Networks with special neurons having their own memory, used for speech recognition, text processing (NLP – natural language processing) or time series analysis
- GAN (Generative Adversarial Networks)
- Networks enabling generating artificial data which are indistinguishable from the originals (e.g. generating human faces, duplicating similar data sets, creating artificial scenes)
Data Science and Modeling
The effectiveness of models created using machine learning techniques is mainly based on the quality and quantity of data that will be used in the learning process. However, the acquisition of the relevant data is only the beginning, most often the raw data has to be analyzed and processed with great care before it can be used in the learning process. All the activities related to data preparation are called Data Science.
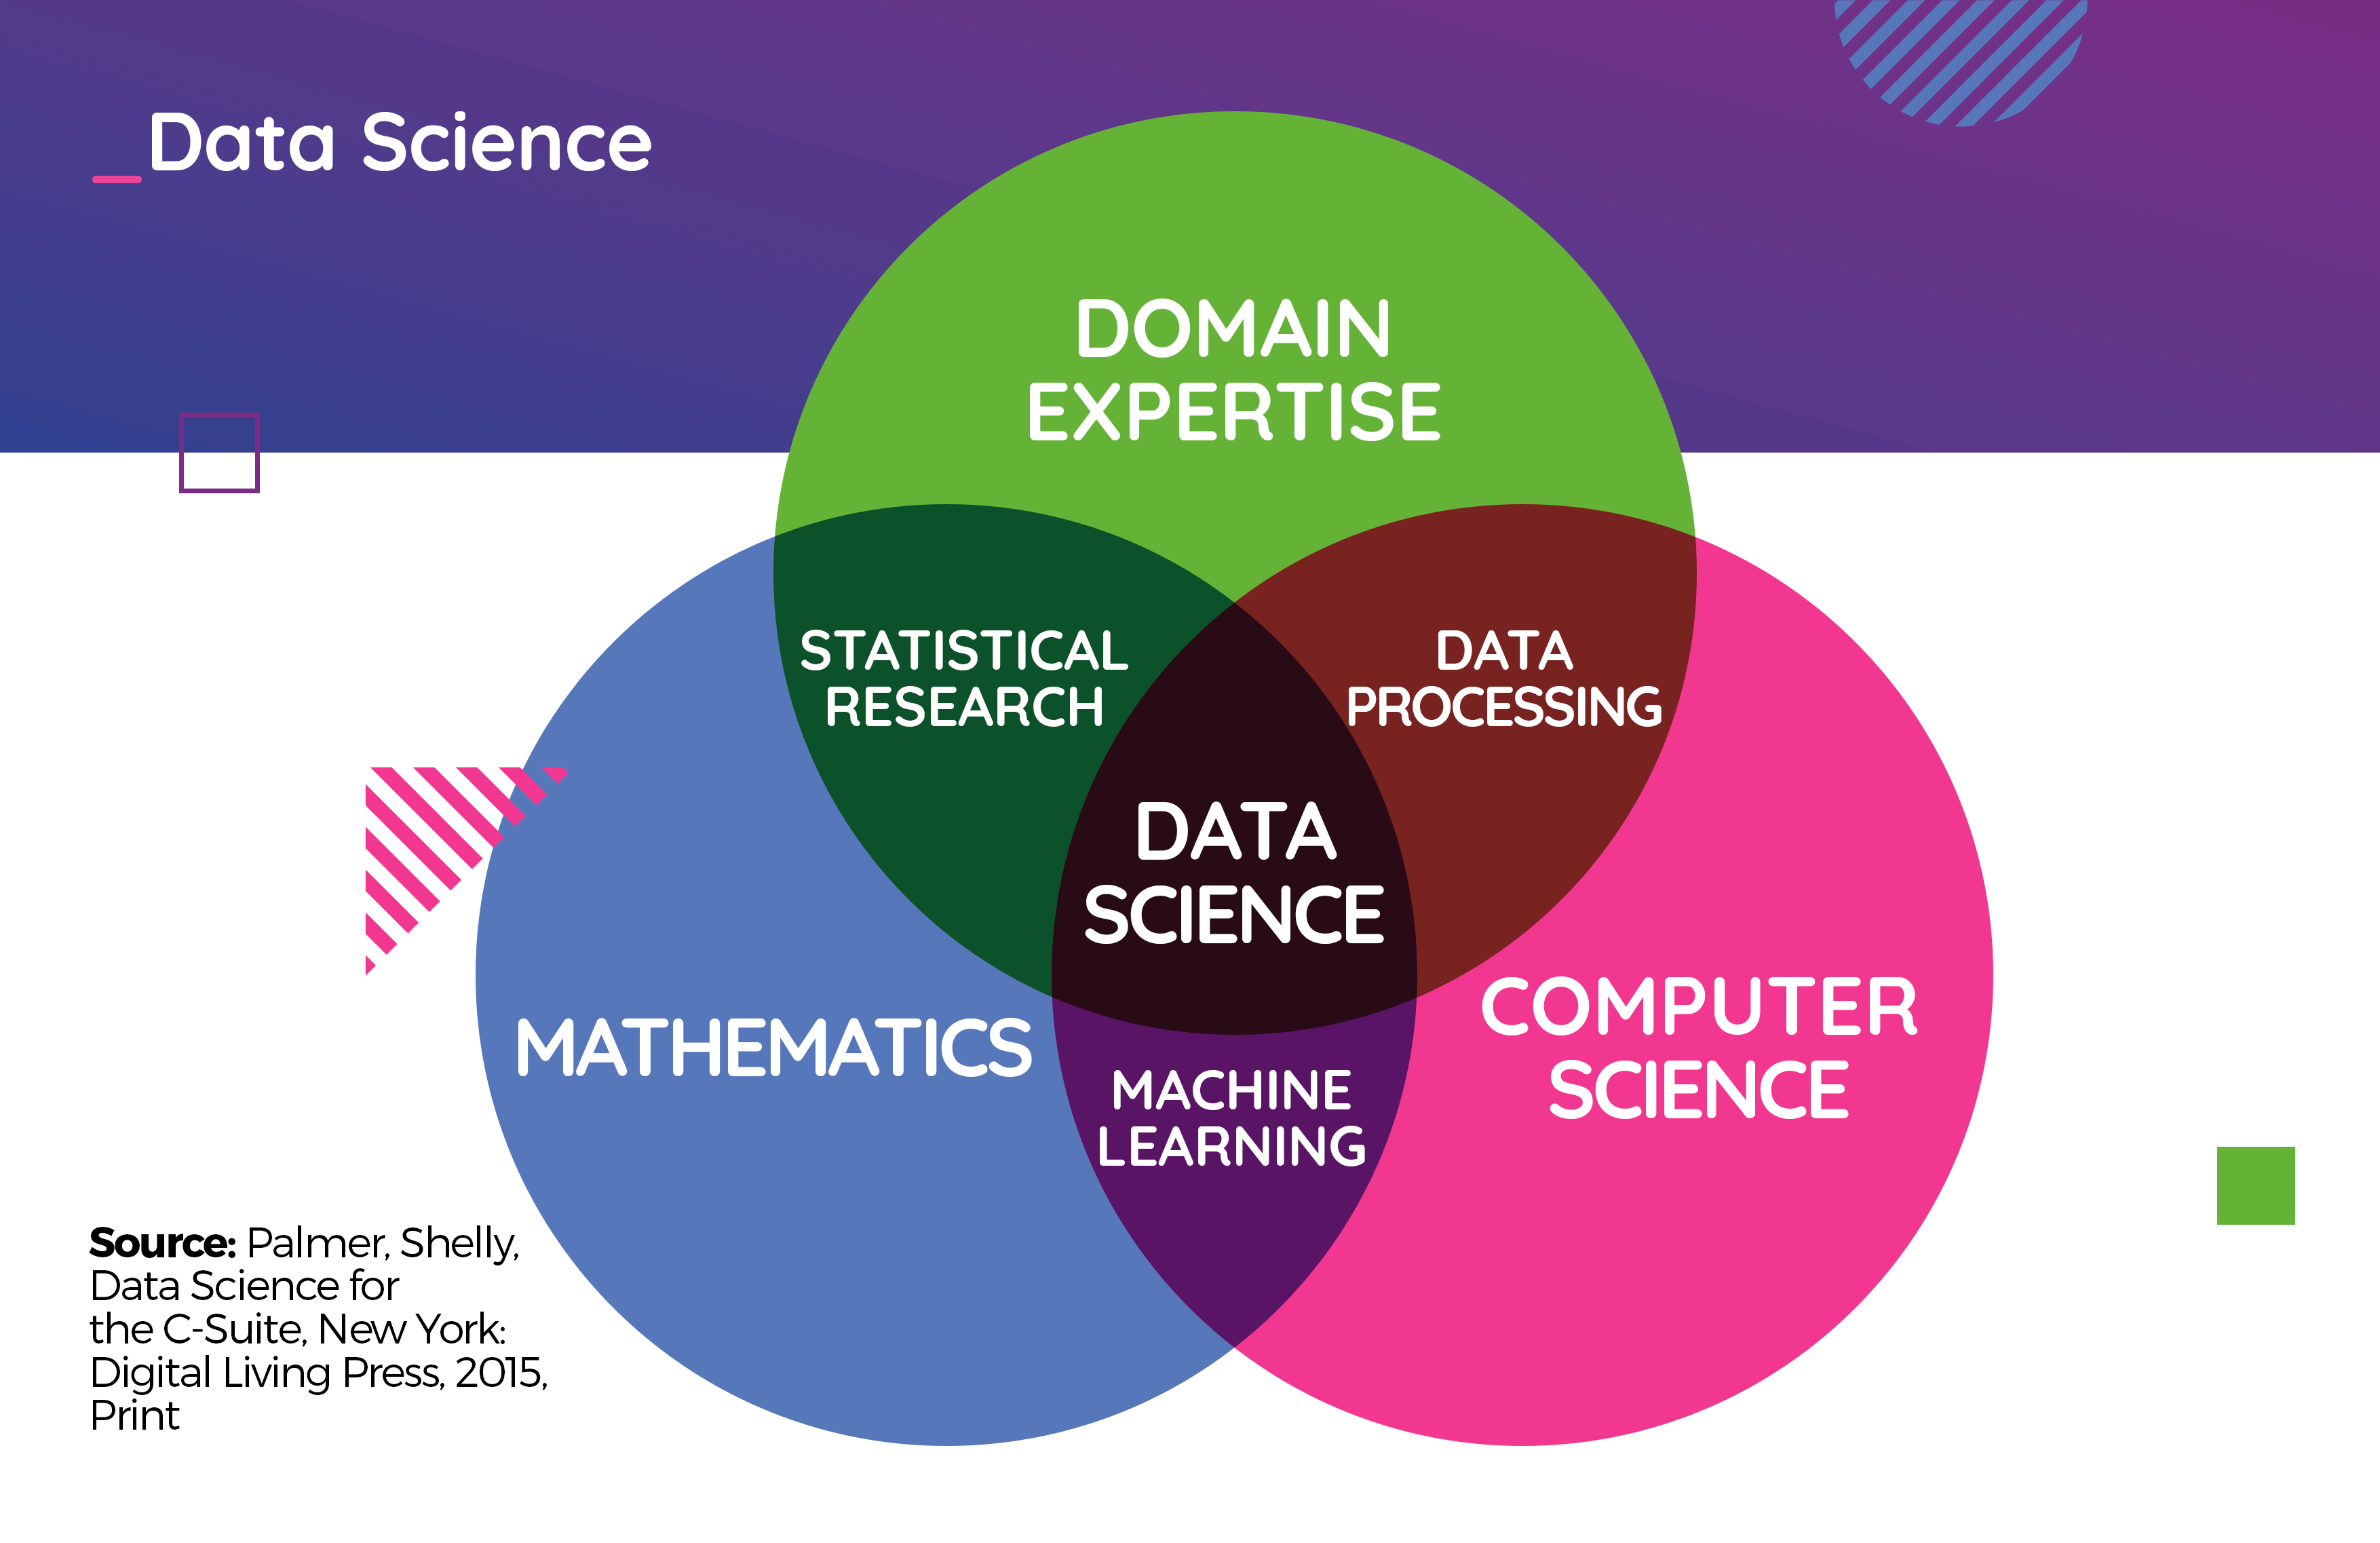
8) Data Science
Typical activities preceding the modeling process include:
- Cleanup of data
- Initial analysis for correlations
- Features reduction
- Features extraction
- Removal of outliers
- Normalization
- Data Balancing
- Sequencing (for time series)
With the data prepared this way, you can proceed to the selection of the machine learning technique (the type of model you want to create, such as linear regression or MLP neural network) and the selection of appropriate learning parameters. Depending on the complexity of the task, the amount of data, model architecture, computing power of the equipment and many other factors, the process of learning itself can take from a few seconds to many hours/days. However, if we are lucky enough we are going to develop a model that will provide the functionality we are looking for (a ready-made algorithm, even though we don’t write a single line of code telling the machine how to solve this problem).
Prognosis of SARS-CoV-2 infections
The problem of predicting the number of coronavirus infections in Poland and around the world is not trivial and can be compared to an analysis of the stock market price. We do not know if tomorrow there won’t be another outbreak that nobody expected. The number of potential variables is very large, and what makes it even more difficult to solve the problem is the fact that the wave of infections is not simultaneous in all countries – in China we are already observing the expiration of the epidemic, and in Brazil the peak of incidence is probably just ahead of us. Furthermore – some countries show unusual patterns (e.g. Taiwan) and their presence increases the complexity of the task. Considering all this, it sounds like an excellent problem that we can try to solve with machine learning. From a technical point of view – we are dealing here with a time series regression task.
Access to the relevant data (a blessing in disguise) was not a big challenge – there are hundreds of all kinds of data sets collected on a regular basis on the Internet. Of course, the main focus should be on the data processing itself, part of Data Science (80% of the total time) and on the proper preparation of the learning set.
The next step was modeling, and thus the difficult decision to choose the right type of model. Considering the versatility of neural networks, I first applied MLP type networks, and then tried to use convolutional networks (which, contrary to appearances and common opinion, can be successfully used not only in image analysis, but also as an alternative to MLP or recurrent networks in time series modeling). Surprisingly, both architectures (MLP and CNN) have been able to satisfactorily map the disease curves for most countries around the globe and, moreover, they have made it possible to predict future values associated with the spread of the infection, which makes it possible to determine whether a country has already gotten over the hump or whether everything is still ahead.

9) Prediction of the number of confirmed COVID-19 infections in Poland 7 days ahead as of May 25th, 2020
The precision of both models fluctuated between 70-75%, noting that the process of teaching convolutional networks was noticeably faster (this results directly from differences in topologies and the way MLP and CNN networks work). This result could be significantly improved by spending more time on the selection of appropriate learning parameters or using other types of models (like LSTM networks).
ThingWorx in the service of visualization
When creating models using machine learning techniques, integration with existing software or even simple visualization is a very common problem. ThingWorx software can be successfully used to integrate with any data source and then create powerful web applications that provide the desired functionality.
Concerning coronavirus infection prediction, an application has been implemented in ThingWorx that integrates with the Python model (with Keras/TensorFlow/Flask libraries). It enables us to choose any country, analyze historical data about the disease and make predictions about future values (up to 90 days forward). Moreover, ThingWorx processes raw data obtained by the model ‘on-the-fly’ and, using numerical methods, flattens the curves (so-called smoothing) in order to analyze the trend curve more precisely.
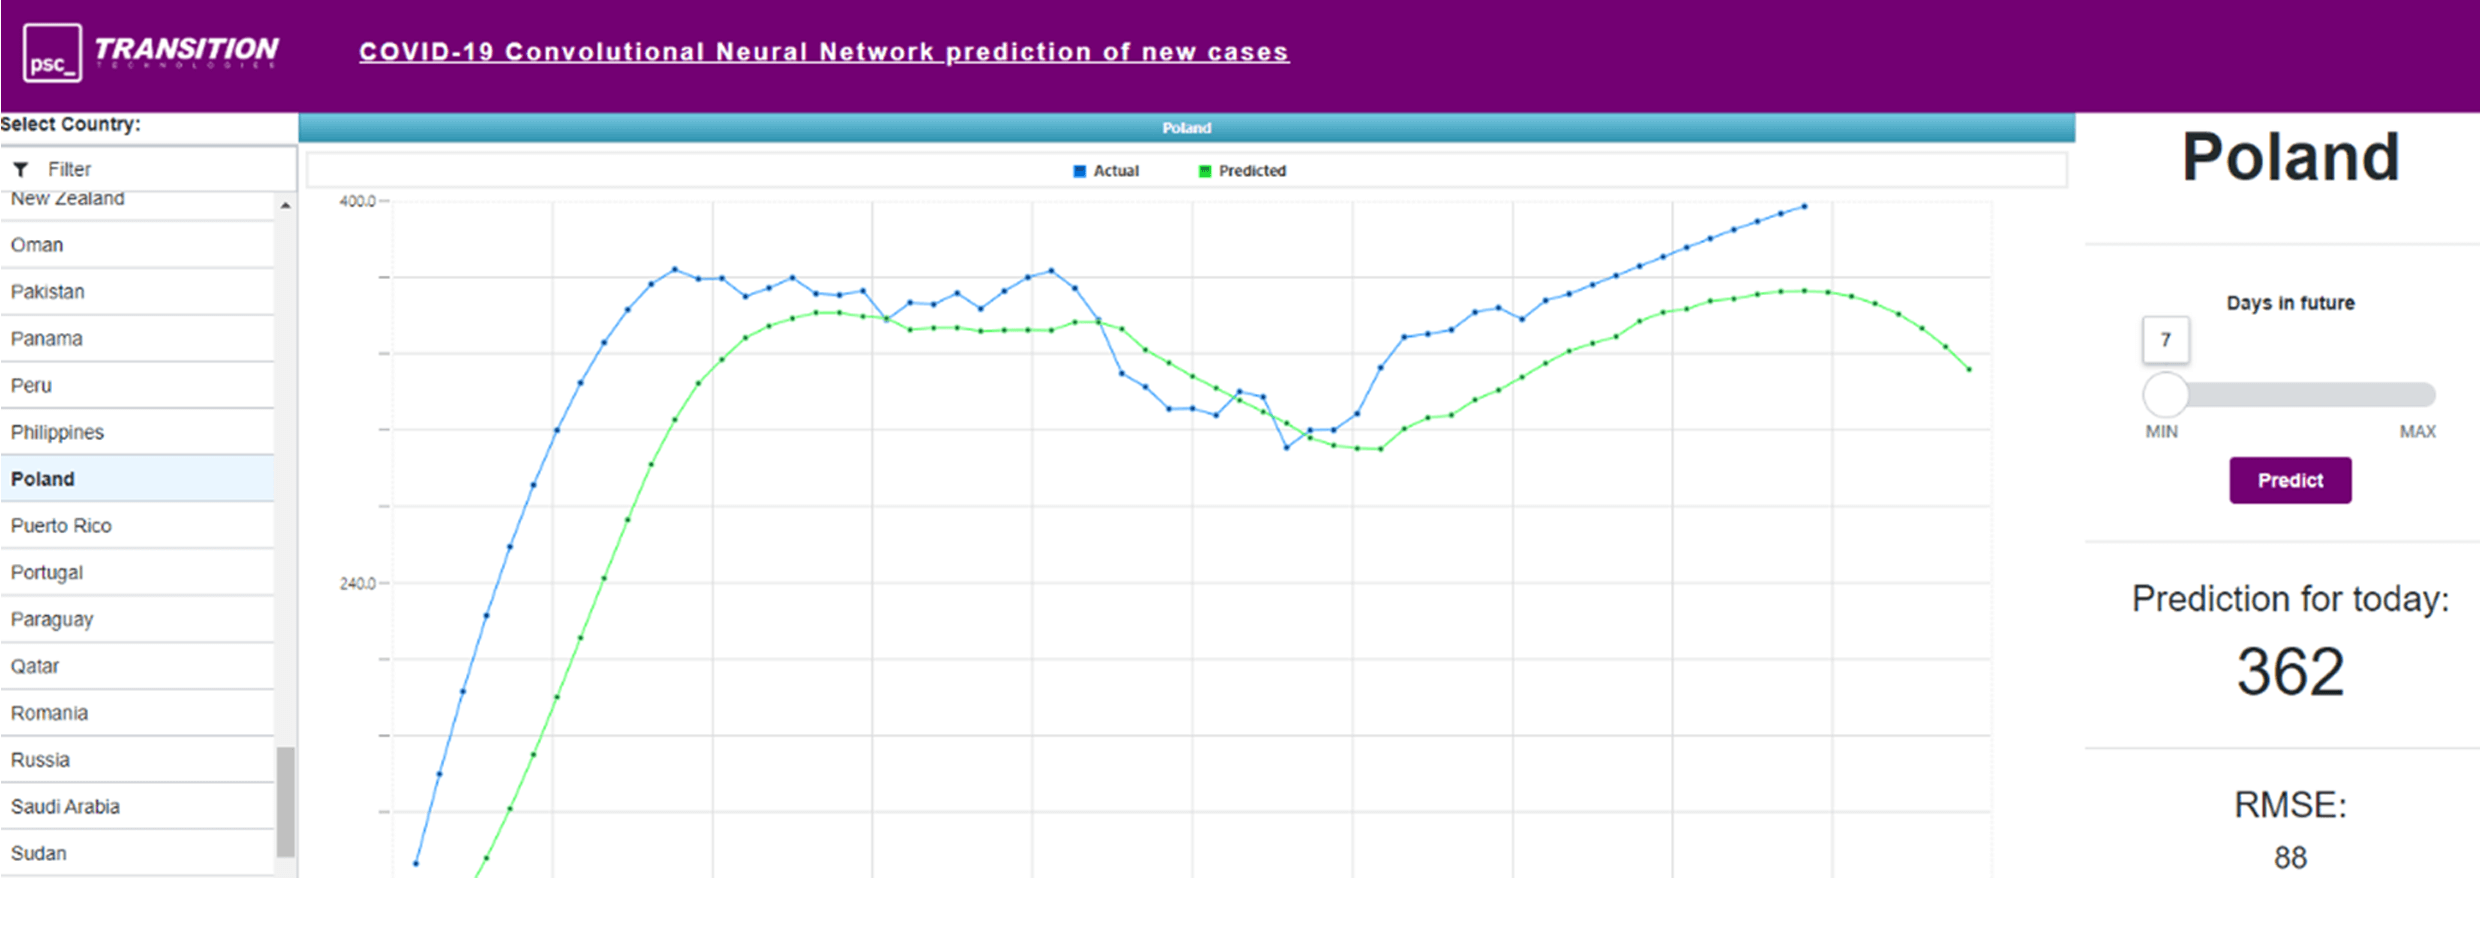
10) Model operation visualization in ThingWorx (with additional curve flattening)
Artificial Intelligence as the thing of the future?
Considering the fact that machine learning can be applied wherever the definition of an algorithm is non-trivial, we could say that traditional programming will be gone – why bother and think about designing an algorithm and implementing a program while the machine can „learn” how such an algorithm should look like and do all the „dirty work” for us – and it can do it quite effectively, as shown in this article and the results obtained during the prognosis of confirmed SARS-CoV-2 infections. And this is probably true, as over the next few years technologies related to AI and machine learning will probably become a standard in the service portfolio of most of today’s „traditional” programmers.
If you are looking for Internet of Things and Data Science solutions feel free to contact us!